The JASON Team release JASON Version 4.0
The JASON Version 4.0 release brings with it improvements in a number of areas. We have introduced a reference deconvolution processing item providing simple application of this powerful tool. Peak analysis for 1D NMR spectra is now even better with the ability to fix fitting parameters allowing greater control in your analysis. Charts are now easier to navigate with mouse modes for zooming and panning, just like for NMR spectra.
As summer approaches, it is a good time to start thinking about relaxation, and JASON is no exception! We have enhanced our ROSY processing for relaxation experiments which is now able to handle T2 and saturation-recovery experiments. We have also added the option to display stacked data all in a single color in addition to the color gradient option.
There have been multiple improvements for annotations, rules, tables and more. As usual, we made a few “under the bonnet” improvements for usability and performance, and destroyed a few nasty bugs.
Let’s have a look at some of these improvements in more detail:
Arrayed experiments and relaxation analysis
New analysis options can be selected for CPMG T2 and T1 saturation-recovery experiments adding to the previous support for T1 inversion recovery. The automatic option selects the correct model based on experiment recognition, which can be seen in spectrum watermark when data is loaded. The corresponding equations used by the model can be viewed in the fitting dialog.

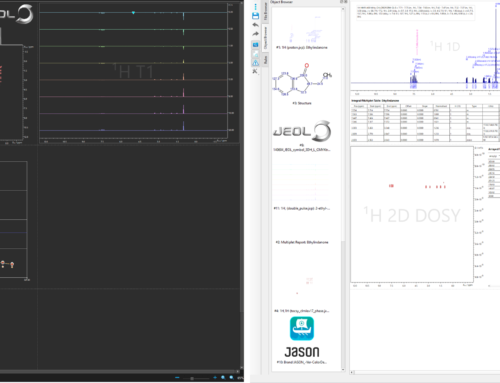
JASON Version 4.0 introduces the ability to report relaxation data as either relaxation rate or relaxation time. Below we can see how you can select either the relaxation time (top left) or relaxation rate (bottom left) option in ROSY processing. The results table contains T1 or R1 data respectively. The fitting details are shown for the methyl proton in the right top, and the arrayed table contains all integrals used in this example is on the lower right.

Reference deconvolution processing
Below is an example of using reference deconvolution to improve the quality of DOSY data. The parameters used in this example are show on the left while the DOSY data are shown on the right.
The same processing without reference deconvolution (top) and with reference deconvolution (bottom) was used when fitting decay of peak heights. The selected region contains two protons: a doublet from geraniol and a singlet from quinine in a mixture of quinine, camphene, and geraniol in methanol-d4. The underlying phase errors are removed when we use reference deconvolution, resulting in much better agreement between two lines of the geraniol doublet. The narrowing of the lines in vertical projection correspond to reduced fitting errors. Reference deconvolution improves accuracy and quality of estimates of diffusion coefficients by NMR.

More flexibility for peak analysis
The peak analysis and deconvolution have been further enhanced. When a user requests peak picking, JASON already does a sophisticated and very fast peak analysis and models all the peaks in the spectrum. The peak models, their sum and fitting residual could be visualized. It’s already possible to add missing or remove wrongly detected peaks and refit the spectrum using the “Fit model” functionality. Now it’s possible to do even more: individual peak parameters can be fixed and not changed during the automatic fitting routine! To do so, create a “Peak Table” and click “Edit fixed parameters” in the Table Tools panel.

After that fixing some parameters is as easy as clicking the checkbox next to it. Clicking “Fit model” on the NMR “Analysis” panel and it will do extra fitting steps, but the fixed parameters will be unchanged.
The compress processing item
With the new compress processing, memory usage and disk storage are reduced by removing imaginary components from the processed data. The imaginary components of the original raw data (FID) are retained. As an example, file size reductions of 22% for 1D data, 57% for hetronuclear 2D spectra and 78% for 3D were achieved using the compress processing after the standard two times zero filling in each dimensions. Note, actual values depend on size of data matrix with respect to parameters.
Charts and tables updates
Tables now have titles by default (see the ROSY and Arrayed table examples above) which can be edited, alongside further improvements for table resizing.
It is now easier to navigate around your charts with the new mouse modes for zoom, pan and cursor crosshair introduced.
Download and try it now!
Download or update your JASON here and start your summer of relaxation now!
These are just some of the highlights included in the JASON version 4.0 release, for full details of the new features, please click here.
